
Leveraging Data Through Transitions
We're coming up to the end of another school year - can you believe it? Transitions are on our minds. Our students have worked hard to learn and grow in their behavior development over this past year, and as we approach the end of the year, it gives us a chance to reflect on their progress.
- How are we determining and communicating intervention supports as we move students into a new school year and potentially a new campus?
- Should we add additional supports as they move into a higher grade level with more rigorous content?
- Can we fade supports as students begin to show independence?
With the summer break coming up, we want to ensure we have our transition plans in place to start the next year off smoothly. As you build out these transition plans, here are some ideas and tools to consider utilizing in your process.
Evaluate the Daily Behavior Report Card (DBRC):
During your student support teams meetings, you'll discuss the interventions students receive and determine whether to maintain or adjust their support so each student has what they need to succeed from day one.
You likely set up some goals for the student over the last year that you can look at and see how they are progressing. Depending on how they are doing, you might fade interventions to move a student from higher supports (Tier 2) to fewer supports (Tier 1) or add supports and move them to a higher level of support (Tier 3). The DBRC (Daily Behavior Report Card) is an evidence-based data tool that allows you to measure student skill acquisition, recognize behavior patterns, and determine students' independence levels. When transitioning, this data is critical to ensuring accurate decision-making for students.
Let's talk about goals.
Goals are made up of four parts and can easily be remembered by ABCD.
- A is the antecedent - Under what circumstances does the behavior occur?
- B is the observable behavior we measure: What does desired behavior look or sound like?
- C is the criteria - What data standard indicates mastery of the goal?
- D is the determinant (often forgotten!) - How long or to what level must criteria be maintained to indicate mastery?
Below is an example of a behavioral goal that contains all four parts: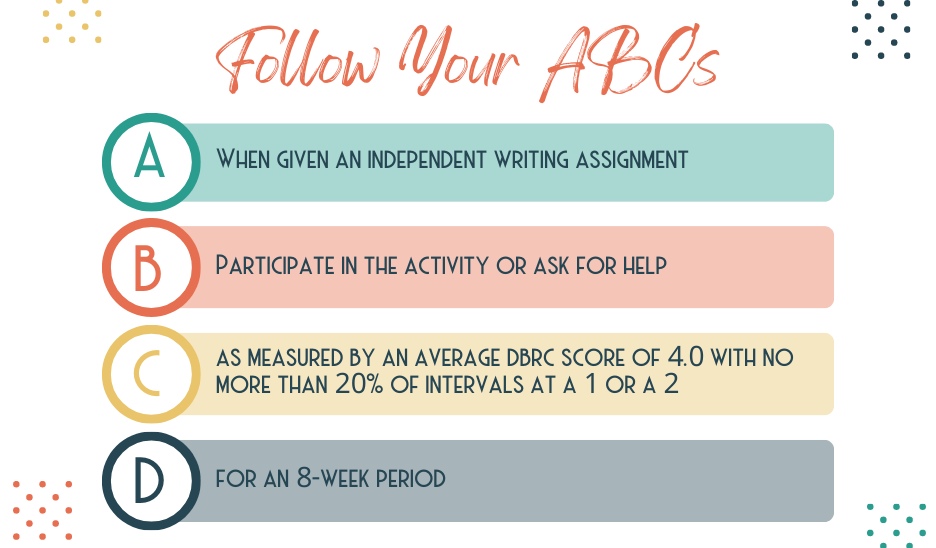
How do we measure and determine transition needs in a data-informed approach?
Let's look at some data to see what patterns might exist and what decisions these might lead to.
First, you must define your progress rubric (check out this other blog post) if you'd like to dig deeper into how to scale behavior goals). Now that you have accurate and frequent insight into the student's skill display, we can determine the student's progress level. Let's look below at possible data sets and what decisions we might make for the transition into the next school year:
Example: Limited Progress = Adjust or Increase Supports
In the graph below, the student has yet to achieve mastery of their goal, and given the flat nature of their chart, they haven't made the progress we had hoped or expected. This data indicates that the student will likely need continued support the following year.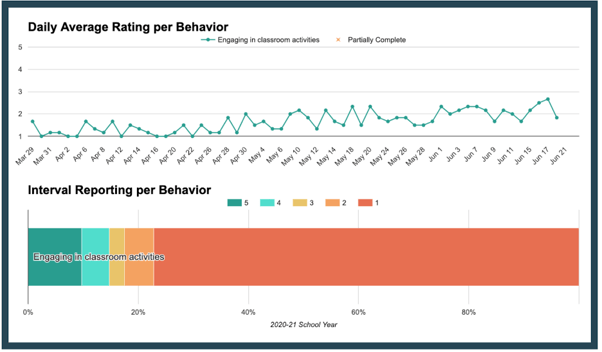
Example: Measurable Progress = Sustain Supports
In this case, the student has made exciting progress! But we have yet to see a sustained level of mastery. Although we could consider reducing or adjusting supports in the coming year, we still need to display sustained mastery of the skill, which indicates an ongoing need. Although students indeed mature as they age, it is unreasonable to count on the necessary mastery over just eight weeks of summer. In this case, consider maintaining support as you begin next year, precisely as it is being delivered this year. This will allow you to quickly assess and fade when you find the student has made progress over the summer versus trying to recover for lost time and challenging experiences due to initially under-supporting.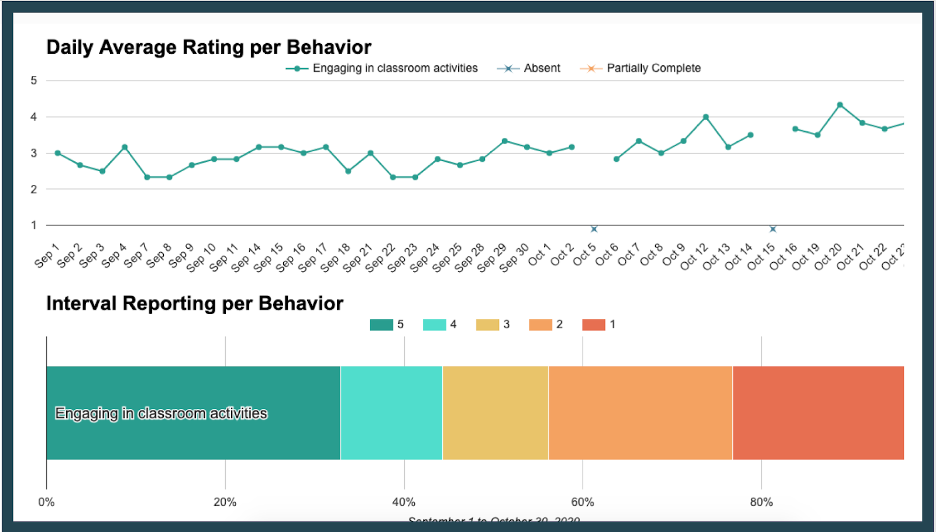
Example: Sustained Mastery = Fade Supports
The graph below shows a student maintaining a mastery level for the expected timeline. At this point, we should start discussing fading the support (click here to access a recent post about effective fading procedures). Remember to provide ample time to fade and measure when considering fading supports before transition. Fading procedures should begin at least a month before the end of the year. We want to ensure the student can sustain behavioral performance without intervention support before we finalize our transition plan.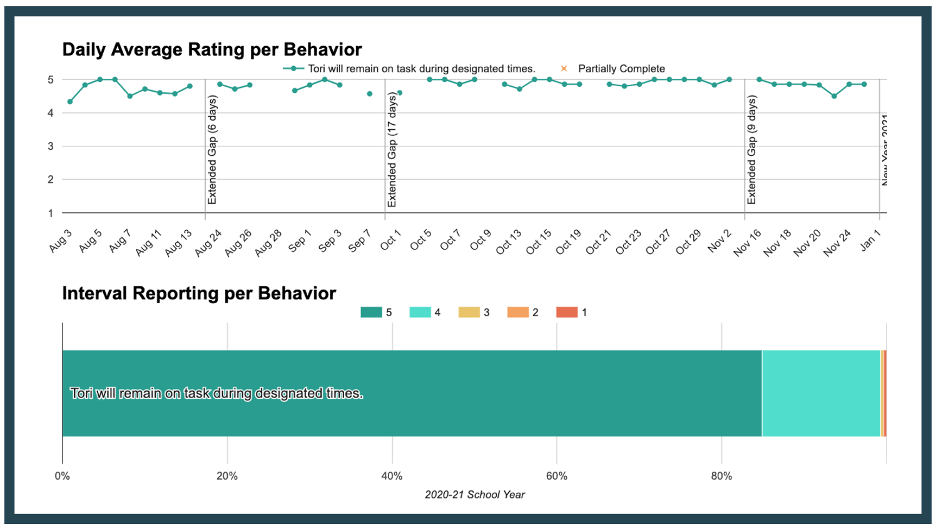
Data is your friend.
Understanding what the data is expressing and how to leverage it is critical. Invest in taking consistent, accurate progress monitoring data to make informed decisions throughout the year, including end-of-year transition planning.
Advice for students transitioning campuses and/or teachers:
When students transition from elementary to middle, middle to high, etc., we need to ensure a strong transition process happens between grade levels. The students must have supports and experience consistency through the transition.
- Sync with teachers and counselors to ensure the DBRC transitions to the new campus/teacher.
- Help connect the student to their new mentor.
- Verify the student has a plan for where to meet their new mentor & complete their check-in/out.
Transition is hard for everyone but even more challenging for students needing social, emotional, or behavioral support. Making data-informed decisions for transitions will ensure that students can make the shift as smoothly as possible.
Make sure you have the right tools handy:

Comments